generic rectangle
graph
![]()
greater than
greatest common factor (GCF)
| A | B | C | D | E | F | G | H | IJK | L | M | N | O | P | Q | R | S | T | UV | WX | YZ |
|---|---|---|---|---|---|---|---|---|---|---|---|---|---|---|---|---|---|---|---|---|
| Algebra Connections Glossary | ||||||||||||||||||||
generic rectangle |
|
|---|---|
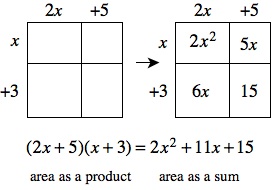
| A type of diagram used to visualize multiplying expressions without algebra tiles. Each expression to be multiplied forms a side length of the rectangle, and the product is the sum of the areas of the sections of the rectangle. For example, the generic rectangle below can be used to multiply (2x + 5) by (x + 3).
|
|
graph |
|
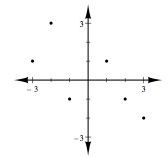
| A graph represents numerical information spatially. The numbers may come from a table, situation (pattern), or rule (equation or inequality). Most of the graphs in this course show points, lines, and/or curveson a two-dimensional coordinate system like the one below or on a single axis called a number line (see below). (See “complete graph.”)
|
|
greater than |
|
| One expression is greater than another if its value is larger. We indicate this relationship with the greater than symbol “>”. For example, 4 + 5 is greater than 1 + 1. We write 4 + 5 > 1+ 1. | |
greatest common factor (GCF) |
|
| (1) For integers, the greatest positive integer that is a common factor of two or more integers. For example, the greatest common factor of 28 and 42 is 14. (2) For two or more algebraic monomials, the product of the greatest common integer factor of the coefficients of the monomials and the variable(s) in each algebraic term with the smallest degree of that variable in every term. For example, the greatest common factor of 12x³y² and |
|
growth |
|
| One useful way to analyze a mathematical relationship is to examine how the output value grows as the input value increases. We can see this growth on a graph of a linear relationship by looking at the slope of the graph. | |
growth factor |
|
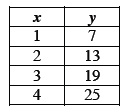
| When two quantities are in a linear relationship, the growth factor describes how much the output value changes when the input value increases by 1. For example, the x → y table below shows a linear relationship with a growth factor of 6. The growth factor is equal to the slope of the line representing a linear relationship. The growth factor is also equal to the value of m when the relationship is represented with an equation in y = mx + b form.
|
|
growth number |
|
| See “growth factor.” | |
Guess and Check |
|
| A strategy for solving problems that starts with making a guess and then checking whether that guess is a correct solution to the problem. If the guess is not correct, the checking process helps suggest a closer next guess. The second guess is then checked. This process is repeated until a correct solution is found. Being organized is critical to using Guess and Check successfully. A table is one good way to organize your work. The Guess and Check process leads to writing equations to represent and solve word problems. | |