deductive reasoning
See “justify.”
degree
dependent variable
difference of squares
| A | B | C | D | E | F | G | H | IJK | L | M | N | O | P | Q | R | S | T | UV | WX | YZ |
|---|---|---|---|---|---|---|---|---|---|---|---|---|---|---|---|---|---|---|---|---|
| Algebra Connections Glossary | ||||||||||||||||||||
deductive reasoning |
|
|---|---|
See “justify.” |
|
degree |
|
| (1) The degree of a monomial is the sum of the exponents of its variables. For example, |
|
dependent variable |
|
| When one quantity depends for its value on one or more others, it is called the dependent variable. For example, we might relate the speed of a car to the amount of force you apply to the gas pedal. Here, the speed of the car is the dependent variable; it depends on how hard you push the pedal. The dependent variable appears as the output value in an x ® y table, and is usually placed relative to the vertical axis of a graph. We often use the letter y for the dependent variable. When working with functions or relations, the dependent variable represents the output value. (Also see “independent variable.”) | |
difference of squares |
|
| A polynomial that can be factored as the product of the sum and difference of two terms. The general pattern is x² −y² = (x +y)(x − y). Most of the differences of squares found in this course are of the form a²x² − b² = (ax + b)(ax − b), where a and b are nonzero real numbers. For example, the difference of squares 4x² − 9 can be factored as (2x + 3)(2x − 3). | |
dimensions |
|
The dimensions of a flat region or space tell how far it extends in each direction. For example, the dimensions of a rectangle might be 16 cm wide by 7 cm high. |
|
discrete graph |
|
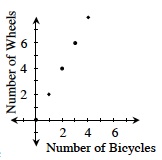
A graph that consists entirely of separated points is called a discrete graph. For example, the graph shown at right is discrete. (Also see “continuous.”)  |
|
discriminant |
|
| For quadratic equations in standard form ax² + bx + c = 0, the discriminant is b − 4ac. If the discriminant is positive, the equation has two roots; if the discriminant is zero, the equation has one root; if the discriminant is negative, the equation has no real-number roots. For example, the discriminant of the quadratic equation 2x² − 4x − 5 is (−4)² − 4(2)(−5) = 56, which indicates that that equation has two roots (solutions). | |
Distributive Property |
|
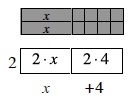
| We use the Distributive Property to write a product of expressions as a sum of terms. The Distributive Property states that for any numbers or expressions a, b, and c, a(b + c) = ab + ac. For example, 2(x + 4) = 2 · x + 2 · 4 = 2x + 8. We can demonstrate this with algebra tiles or in a generic rectangle.  |
|
dividing line |
|
| See “boundary line.” | |
dividing point |
|
| See “boundary point.” | |
domain |
|
| The set of all input values for a relation or function. For example, the domain of the function graphed at right is x > −3. For variables, the domain is the set of numbers the variable may represent. (Also see “range.”)
|
|