bar graph
base of a geometric figure
base of an exponent
bimodal
| A | B | C | D | E | F | G | H | IJK | L | M | N | O | P | Q | R | S | T | U | V | WXYZ | |
|---|---|---|---|---|---|---|---|---|---|---|---|---|---|---|---|---|---|---|---|---|---|
| Making Connections Glossary | |||||||||||||||||||||
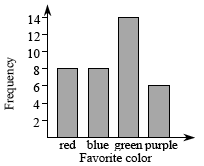
bar graph |
|
|---|---|
| A bar graph is a set of rectangular bars that have height proportional to the number of data elements in each category. Each bar stands for all of the elements in a single distinguishable category (such as “red”). Usually all of the bars are the same width and separated from each other. (Also see histogram.)
| |
base of a geometric figure |
|
| (a) The base of a triangle: any side of a triangle to which a height is drawn. There are three possible bases in each triangle. (b) The base of a trapezoid: either of the two parallel sides. (c) The base of a parallelogram (including rectangle, rhombus, and square): any side to which a height is drawn. There are four possible bases. (d) The base of a solid: also see cone, cylinder, prism, and pyramid. | |
base of an exponent |
|
| When working with an exponential expression in the form ab, a is called the base. For example, 2 is the base in 25. (5 is the exponent, and 32 is the value.) (Also see exponent.) | |
bimodal |
|
| A set of numbers that has two modes. | |
boundary point |
|
| The endpoint or endpoints of a ray or segment on a number line where an inequality is true. For strict inequalities (that is, inequalities involving < or >), the point is not part of the solution. Boundary points may be found by solving the equality associated with the given inequality. For example, the solution to the equation 2x + 5 = 11 is x = 3, so the inequality 2x + 5 ≥ 11 has a boundary point at 3. The solution to that inequality is illustrated on the number line below. A boundary point is also sometimes called a “dividing point.”
|
|
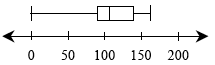
box-and-whisker plot |
|
| A graphic way of showing a summary of data using the median, quartiles, and extremes of the data.
|
|