decision chart
26 · 25 · 24
The decision chart is a short way to represent a tree with 26 branches at stage one, 25 at stage two, and 24 at stage three. (pp. 514, 521)
degree
degree of a polynomial
degree of a polynomial in one variable
| A | B | C | D | E | F | G | H | I | JKL | MN | O | P | Q | R | S | T | UV | WXYZ |
|---|---|---|---|---|---|---|---|---|---|---|---|---|---|---|---|---|---|---|
| Algebra 2 Connections Glossary | ||||||||||||||||||
decision chart |
|
|---|---|
| A decision chart is a method for organizing a counting problem that could be represented by a symmetric tree diagram. Begin by asking how many decisions need to be made, and then mark a space for each decision. Fill in each space with the number of possibilities for that decision. For example a child has a set of 26 blocks, each with a different letter of the alphabet on it. How many three-letter arrangements could he make by lining up any three of his blocks? There are three decisions, with 26 choices for the first letter, 25 for the second, and 24 for the third. To calculate the total number of possibilities the numbers in the decision chart must be multiplied. 26 · 25 · 24 The decision chart is a short way to represent a tree with 26 branches at stage one, 25 at stage two, and 24 at stage three. (pp. 514, 521) |
|
degree |
|
| One degree is an angle measure that is |
|
degree of a polynomial |
|
| The degree of a monomial is the sum of the exponents of its variables. For example, the degree of 3x2y5z is 8. For a polynomial the degree is the degree of the monomial term with the highest degree. Example: for the polynomial 2x5y2 − 4x4z6 + x7z the degree is 10. (p. 440) | |
degree of a polynomial in one variable |
|
| The highest power of the variable. The degree of a polynomial function also indicates the maximum number of factors of the polynomial and provides information for predicting the number of “turns” the graph can take. (p. 440) | |
dependent variable |
|
|---|---|
| The variable whose value is determined by the value of another variable. For a given value of the independent variable, or input, the value of the dependent variable is the output. In an ordered pair, the variable occurring second is the dependent variable. The dependent variable is usually graphed in relation to the vertical axis. (pp. 6, 13, 199) | |
depreciation |
|
| A decrease in value possibly because of normal wear and tear, age, decay, decrease in price. (p. 151) | |
directrix |
|
| A line used to define a conic section. A parabola can be defined as the locus of points equidistant from a line, which is its directrix and a point, which is its focus. (p. 556) | |
discrete graph |
|
| A graph that is made up of separate points. (p. 62) | |
discriminant |
|
| For any quadratic equation ax2 + bx + c = 0, b2 − 4ac is called the discriminant. If b2 − 4ac ≥ 0, the roots of the quadratic are real. If the discriminant is less than 0, the roots are imaginary or complex. (p. 460) | |
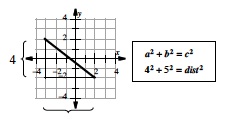
distance formula |
|
| An application of the Pythagorean Theorem to find the distance between two points in a plane. The distance between any two points (x1,y1) and (x2, y2) is
|
|
Distributive Property |
|
| The basis for rewriting products as sums and sums as products. For numbers or algebraic expressions A, B, and C, A(B + C) = AB + AC . (pp. 94, 99) | |
domain |
|
| The domain of a function is the set of possible values for the independent variable or the set of possible input values. It consists of every number that x can represent for the function, in other words every number that has an output. (pp. 16, 18, 199) | |
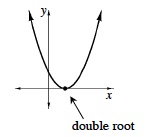
double root |
|
| A root of a function that occurs exactly twice. If an expression of the form (x − a)2 is a factor of a polynomial, then the polynomial has a double root at x = a . The graph of the polynomial does not pass through the x‑axis at x = a but is tangent to the axis at x = a . (p. 446)
|
|